EasyGraph: A Guide to Computing Classic Structural Hole Indicators
Introduction:
EasyGraph is an open-source toolbox for network analysis based on the Python language, developed by DataNet team at Fudan University. It is the first open-source library that includes a comprehensive set of methods for detecting structural hole spanners, while also covering network embedding and various traditional network analysis techniques. EasyGraph supports multiple types of network data with excellent compatibility. Additionally, it leverages hybrid programming and parallel computing to enhance the efficiency of most classic network analysis algorithms.
This article will introduce the process of measuring classic indicators of structural holes, such as effective size, efficiency, constraint, and hierarchy through EasyGraph.
install:pip install Python-EasyGraph
effective size
A node’s ego network(the one-hop network of a central node) has redundancy to the extent that its contacts are connected to each other. The effective size of a node is an indicator to measure the nonredundant connections of a node.
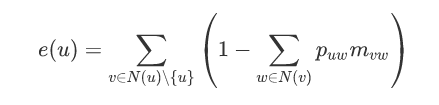
p(u,w) is the normalized mutual weight of the (directed or undirected) edges joining u and w, while m(v,w) is calculated by dividing the normalized mutual weight between v and w by the maximal normalized mutual weight between v and its neighbors.
from easygraph.datasets import get_graph_karateclub
import easygraph as eg
G = get_graph_karateclub()
sz=effective_size(G)
for node,val in sz.items():
	print(node,val)
efficiency
Efficiency is calculated by dividing a node’s effective size by its degree, measuring the nonredundant connections of a node in a normalized manner.
ef=efficiency(G)
for node,val in ef.items():
	print(node,val)
constraint
Constraint is a measure of the extent to which a node is constrained within the ego network. A node with higher constraint implies higher network density and a lower number of structural holes in its neighborhood.
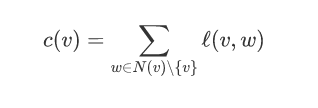
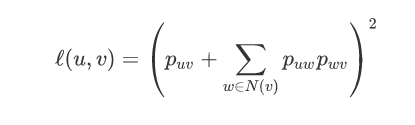
The constraint of a node is the sum of its local_constraints with all neighboring nodes.
cons=constraint(G)
for node,val in cons.items():
	print(node,val)
hierarchy
Hierarchy is an indicator that measures the extent to which the aggregate constraint within the ego network is concentrated in a single contact. while h(i) that equals 1.0 indicates that all the constraint is concentrated in a single contact.
hier=hierarchy(G)
for node,val in hier.items():
	print(node,val)
Here, we test these three metrics including effective size, constraint, and hierarchy to identify structural hole spanners by EasyGraph. Below is an example using the Karate Club dataset.
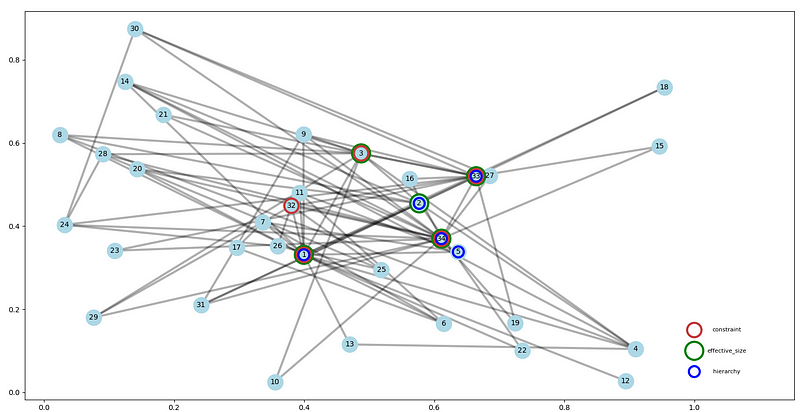
In this figure, the red color indicates the top 5 nodes with the maximum effective size, the green color marks the 5 nodes with the minimum constraint, and the blue color represents the 5 nodes with the minimum hierarchy.
It can be observed that four out of the top 5 nodes with the maximum effective size overlap with the minimum constraint nodes, highlighting a strong association between these classic indicators and structural holes, providing direction for maximizing information dissemination.